
The tectonic plates of the property market are shifting, and increasingly open access to land and property data in recent years – facilitated by HM Land Registry – has dramatically improved our understanding of land ownership across England and Wales.
Excitingly, we are still only watching the opening titles (if you excuse the pun) of a potentially epic story of industry transformation, as more and more property and legal firms switch on to the emerging possibilities.
HM Land Registry made its Commercial and Corporate Ownership Data (CCOD) open for the first time late last year. We’re already using this data within our ForeSite commercial real estate platform to showcase the broader potential of property data to generate new insights.
Land held by domestic corporate and commercial entities
The table shows land held by domestic corporate and commercial entities by region in England and Wales, ranked by ownership per household/person in the region (highest to lowest).
| Region | Land held by corporate/ commercial owners (acres) | % of region held by corporate/ commercial owners | % share of total land in corporate/ commercial ownership |
% share of total land across England and Wales [1] |
Corporate/ commercial owned land, per household [2] (m2) |
Corporate/ commercial owned land, per person (m2) |
| North East | 1,573,657 | 74% | 14% | 6% | 7,387 | 2,415 |
| Wales | 1,415,143 | 28% | 12% | 14% | 5,870 | 1,840 |
| East Midlands | 1,298,524 | 34% | 11% | 10% | 3,544 | 1,112 |
| South East | 2,250,029 | 48% | 19% | 13% | 3,296 | 1,008 |
| South West | 1,339,414 | 23% | 12% | 16% | 3,141 | 982 |
| Yorkshire and Humberside | 1,134,734 | 30% | 10% | 10% | 2,634 | 846 |
| East Anglia | 1,027,957 | 22% | 9% | 13% | 2,196 | 679 |
| West Midlands | 673,596 | 21% | 6% | 9% | 1,540 | 469 |
| North West | 666,203 | 19% | 6% | 9% | 1,167 | 373 |
| Greater London | 203,645 | 52% | 2% | 1% | 286 | 94 |
| England and Wales | 11,582,900 | 31% | 100% | 100% | 3,106 | 803 |
[1] 2011 Census: Population density, local authorities in the United Kingdom
[2] Live tables on household projections: 2014
Source: HM Land Registry/Office for National Statistics/Search Acumen
The findings reveal that around a third of all land in England and Wales – 11.5 million acres – is registered to domestic corporate or commercial entities. This equates to more than 3,000m2 for every household, the equivalent of 12 tennis courts.
While the South East holds the largest share (19%) of domestic corporate and commercially owned land, the importance of the ‘Northern Powerhouse’ and ‘Midlands Engine’ is clearly visible in the significant land holdings by business interests in these areas.
Further south, as the London property market continues to struggle to meet demand, there is also likely to be ongoing pressure on its landowners to find more space for new housing as well as commercial developments.
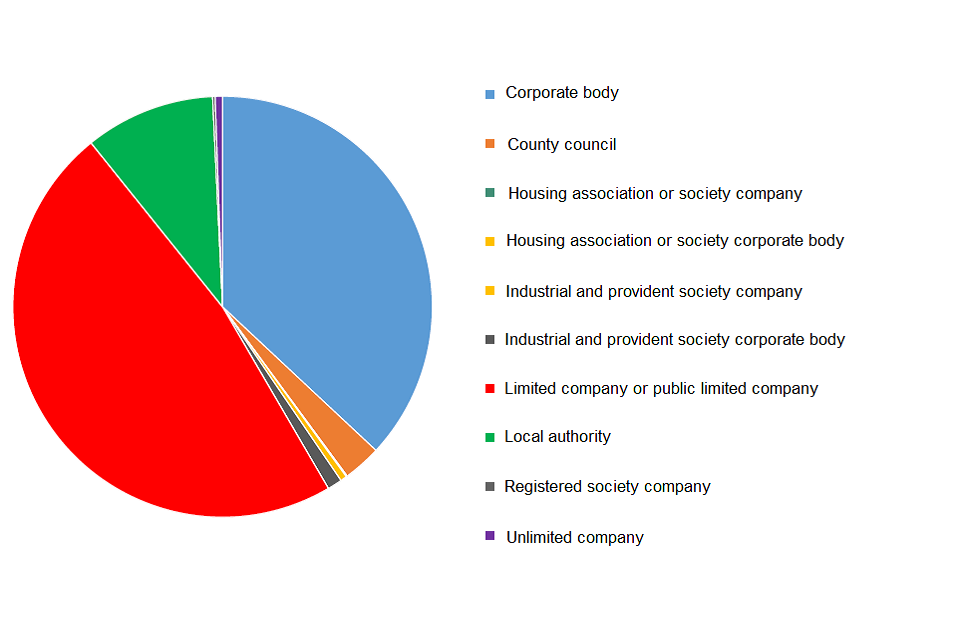
Beneath the headline findings, we were interested to note that only 12% of land registered under CCOD is held by local authorities and county councils. We know this isn’t the full story. Much of the unregistered land in England and Wales is likely to be held by the public sector, and as HM Land Registry continues to drive innovation and digitise our land data, public sector-owned titles within CCOD will increase. This transition can significantly improve the tenancy and transfer process, for example, and will help more people buy properties under right-to-buy.
To make the most of the new digital resources at the nation’s disposal, the key will be to ensure that the growing expanse of data is manipulated quickly and effectively to inform better decision-making.
My enthusiasm for growing businesses has kept me engaged in the online property data sector for more than 18 years where the power of advancing technology, passionate leadership and a customer-driven approach translates into helping create a business that grew from start-up to market leader in five years.
Now with the Search Acumen team we are on a mission to create the next generation of property technology and data business.
About Search Acumen
Search Acumen are property and technology data experts. They deliver solutions for commercial real estate lawyers and conveyancers using emerging technology. Continually pushing the boundaries of what’s possible, they innovate, re-engineer and harness technology for the benefit of their clients.
About HM Land Registry data
HM Land Registry cannot confirm the accuracy of the analysis above of the share of domestic, corporate and commercial land ownership, England and Wales, though we admire the way it has been used and displayed. We understand the potential value our information has to the economy. Property information can be combined with other types of data for all kinds of useful information and new services. Our target is to release as much information as we can from our register by 2020.
4 comments
Comment by John Harvey posted on
Good stuff but analysis of land ownership is only part of the picture.
HMLR uniquely also holds information (eg incidence of requisitions or rejections and of applications not protected by searches) about conveyancers which should be made available to comparison sites etc to help consumers make informed judgements when selecting advisers
Comment by ianflowers posted on
Thank you for your comments. Comments such as yours do inform our considerations in these areas.
Comment by Rachael posted on
Hi. I can't see that Acres data is available from the Land Registry - https://www.gov.uk/government/publications/commercial-and-corporate-ownership-data-technical-specification/commercial-and-corporate-ownership-data-technical-specification How were you able to link it to this? Thanks
Comment by AdamH posted on
Rachael - we sourced land data from HM Land Registry’s National Polygon Service from which we were able to calculate the area. We then referenced this against the Corporate and Commercial Ownership Database (CCOD) to clarify that the land/property is held by a corporate or commercial entity.
We then got the size of each region (in hectares, converted to acres), the population and the number of households from the 2011 ONS census survey (the most recent census).