At Pole Star Digital we are huge fans of MeasureCamp. Several of the team have spoken at MeasureCamp events. When the opportunity arose to showcase our passion for data-led content by entering MeasureCamp's data visualisation competition sponsored by HM Land Registry, we couldn't resist!
Manchester's homelessness crisis
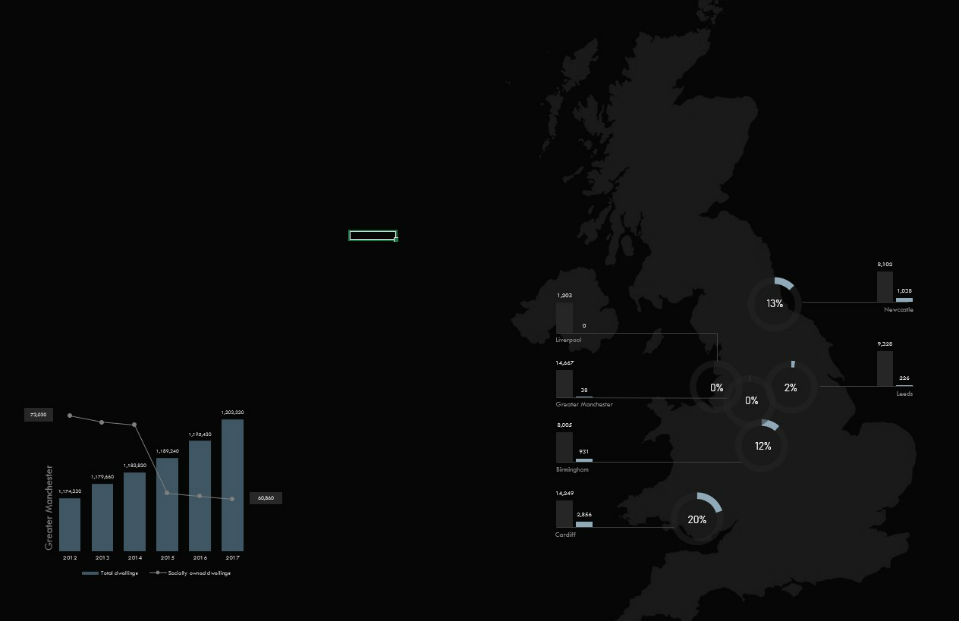
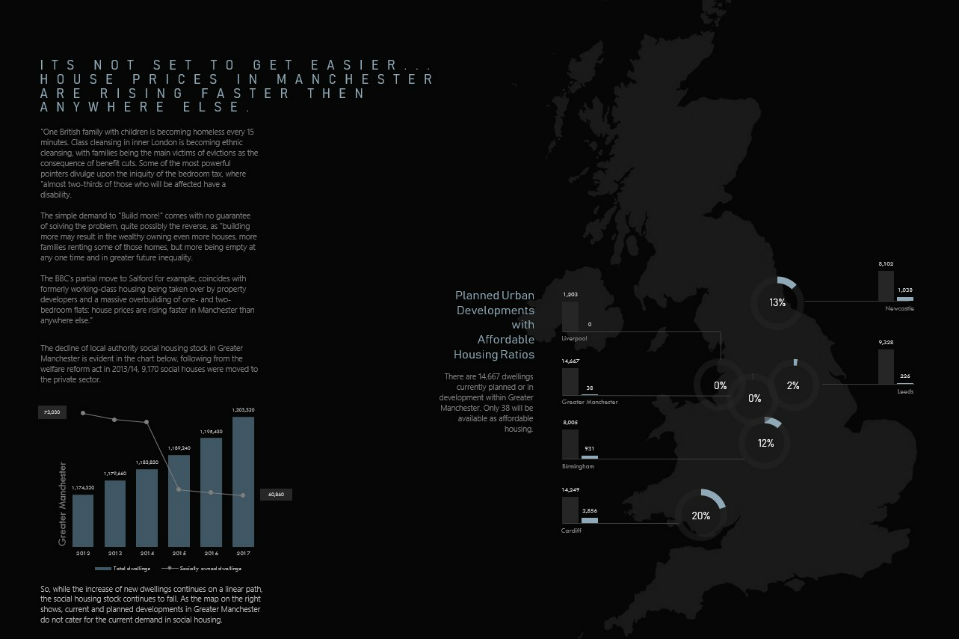
Our prizewinning entry uses data to communicate why the rate of expansion our home city of Manchester is witnessing is causing a potentially dangerous homelessness crisis, literally on its own streets.
Our “why” was put very succinctly by Des Wilson, the co-founder of homelessness charity Shelter.
We all face the consequences when so many grow up without a place to call home. It breaks up communities and wreaks havoc on family life. For the sake of future generations, we must pull together to end this crisis.
At Pole Star Digital are all adopted Mancunians. The spirit of Manchester and its ethos resonates with our own individual values. It’s a city that we all call home and love dearly.
Sadly, it is a place that has a prosperous outlook but – like so many cities globally – due to rapid development, social change and economic challenges, homelessness is sharply on the rise and with little sign of abating.
True to our Mancunian roots, our response to this task was typically non-standard. We also really wanted to see if it’s possible to tell a story that not only turns heads but also hearts.
Creating a data model
We started by accessing the HM Land Registry datasets provided in the competition, including Transaction Data, Price Paid Data and the UK House Price Index.
In order to source complementary datasets, we looked to sites such as GOV.UK and the Office for National Statistics that hold up-to-date and historical statistical information. Once we had access to additional data, we held an ideas session where we explored the correlations between the most expensive areas to live in the UK and homelessness and the HM Land Registry data.
We began to look at sources and HM Land Registry data was pivotal in the story and we also sourced key call outs and additional research from the Manchester Evening News and The Guardian.
Because we decided to move away from the maps and dashboard entries, we couldn’t just populate platform templates. We had to fuse the local district information provided by government departments into a bespoke merging table that placed individual towns and cities externally of local districts.
In essence, we had to create a scaleable data model (see below) that allowed us to query all of our data sources together.
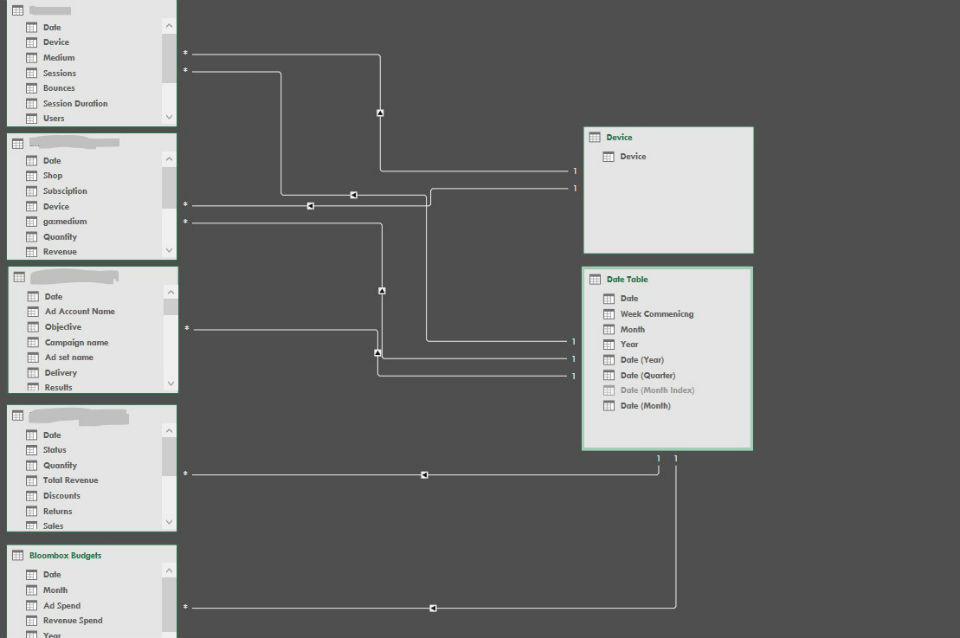
For example, what was the average house price in the North East from 2010 through to 2017 and what was the average annual wage in the same area and time parameters, compared with the South West?
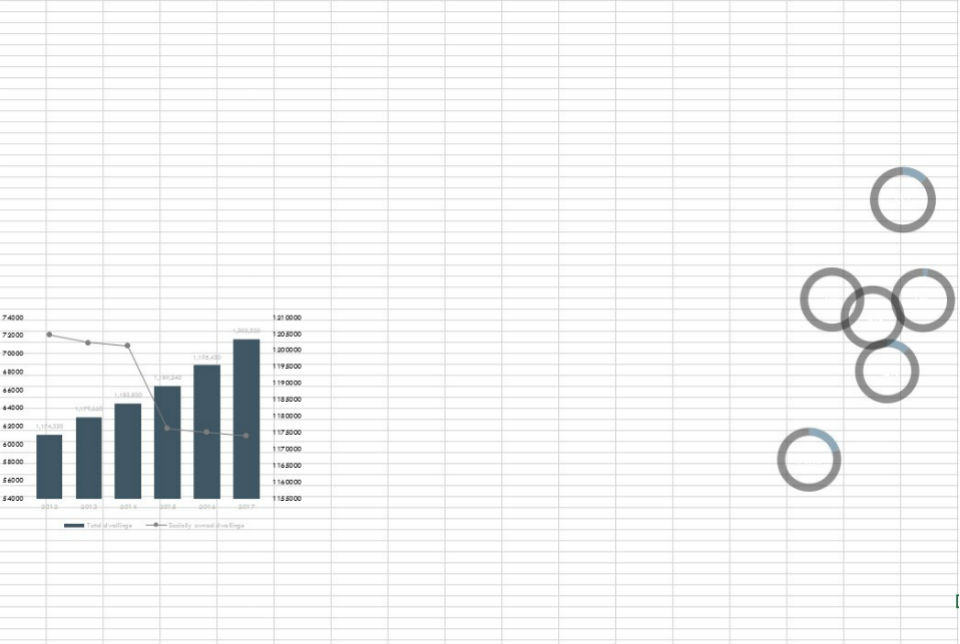
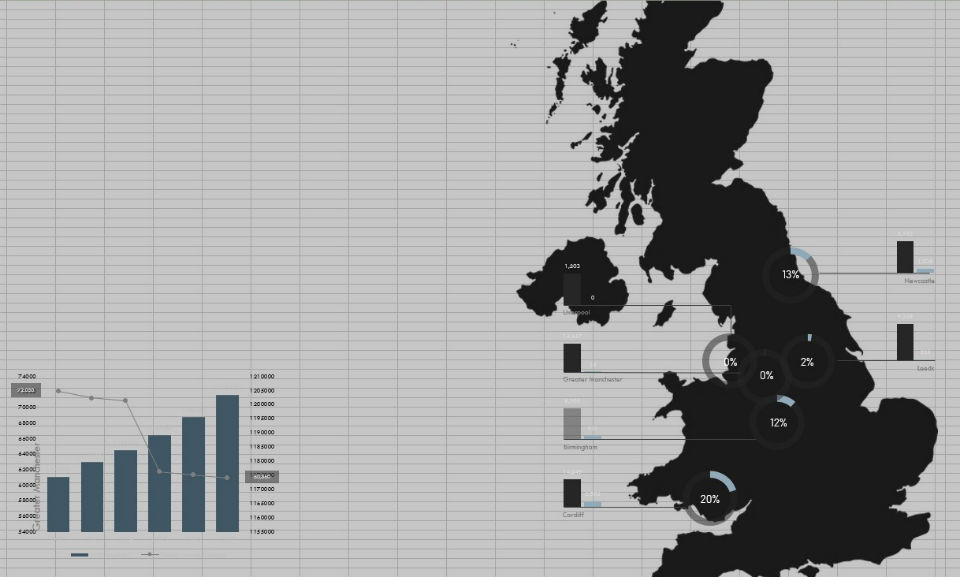
With this built, we could then layer in the story using Excel’s design features. Visuals must be intelligent, simple and purposeful, but the challenge to align these elements together can be extremely problematic as you can see from the sequential images below.
We aspire to produce great work for all our clients, all the time – which makes us no different from most digital marketing agencies or consultants. But we genuinely put data at the heart of what we do, aiming to be different with our ethics and beliefs. We strive to gain recognition for our discipline, which is really the affirmation of our labour and our work.
This is our first award and we are extremely proud. Thank you, MeasureCamp and HM Land Registry!
Geovation
Start-ups with innovative geospatial or property technology ideas are invited to apply to our 2019 Accelerator Programme. For more information on how to apply to the Geovation Accelerator Programme, visit www.geovation.uk/programme or email us at programme@geovation.uk.
Backed by Ordnance Survey (OS) and HM Land Registry, the Accelerator Programme has produced a steady pipeline of success since its introduction in 2015. A total of 84 start-ups have gone through the programme, creating more than 200 jobs and raising £23.3 million in investment funding.